METRIC
A metric is a standard for measuring or evaluating something using numerical values.
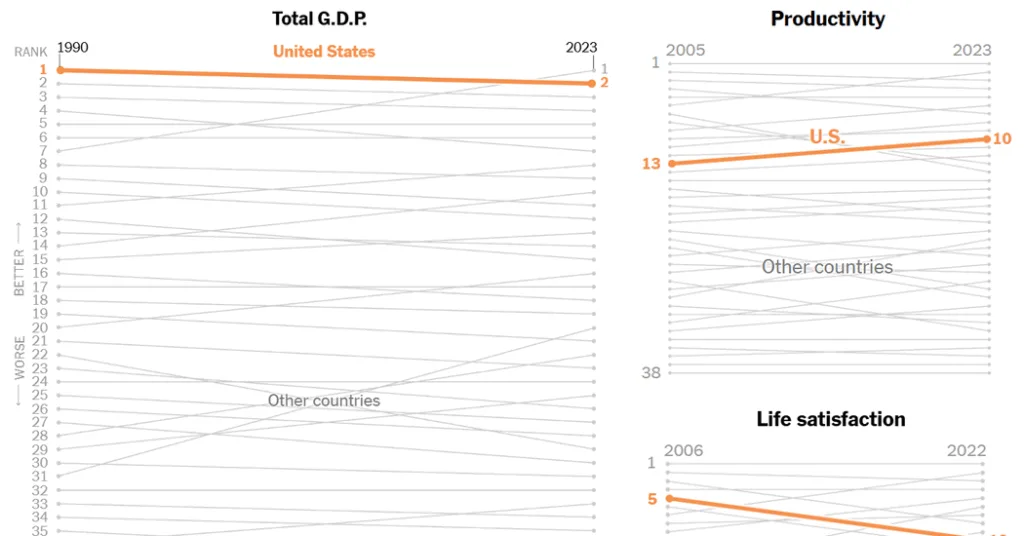
In the well-being graphs, the metrics measure the well-being of the populations in 39 countries. For example, belief in democracy is one metric in the Citizenship & Democracy topic. The source of this data since 1981 has been the World Values Survey which collected data on the belief in democracy using nationally representative samples from 13 countries.
RANK ORDERING
Rank ordering assigns a numerical value based on the order of data values in either ascending order (smallest to largest) or in descending order (largest to smallest).
In the well-being graphs, the countries are ordered by values for each of the 37 metrics and displayed in rank order, either in descending order as in life expectancy, or in ascending order, as in youth depression. This means that the country with the “best” value is ranked first and the country with the worst well-being value is ranked last. For the six featured well-being graphs, the United States largest change in rank order was for the metric “Faith in the federal government,” which dropped from the 20th to 34th rank.
The graph for “What’s Going On in This Graph?” was selected in partnership with Sharon Hessney. Ms. Hessney wrote the “reveal” and Stat Nuggets with Roxy Peck, a professor emerita of statistics at California Polytechnic State University, San Luis Obispo, and moderates online with Kristina Barnaby, a middle school math teacher at Roger Ludlowe Middle School in Fairfield, Conn.
More?
• See all graphs in this series or collections of 75 of our favorite graphs, 28 graphs that teach about inequality and 24 graphs about climate change.
• View our archives that link to all past releases, organized by topic, graph type and Stat Nugget.
• Learn more about the notice and wonder teaching strategy from this 5-minute video and how and why other teachers are using this strategy from our on-demand webinar.
• Sign up for our free weekly Learning Network newsletter so you never miss a graph. Graphs are always released by the Friday before the Wednesday live moderation to give teachers time to plan ahead.
• Go to the American Statistical Association K-12 website, which includes teacher statistics resources, Census in the Schools student-generated data, professional development opportunities, and more.
Students 13 and older in the United States and Britain, and 16 and older elsewhere, are invited to comment. All comments are moderated by the Learning Network staff, but please keep in mind that once your comment is accepted, it will be made public.

