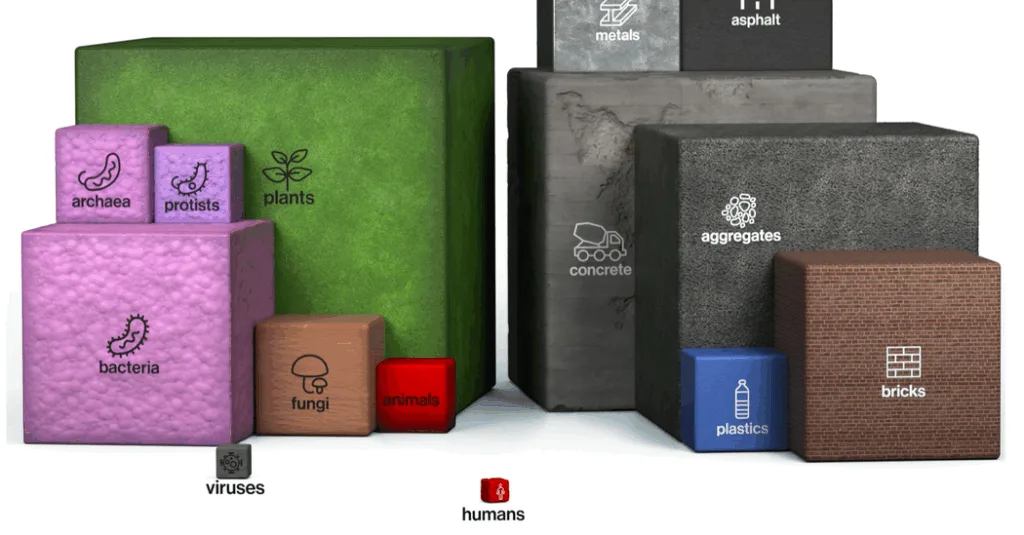
In the biomass and technomass graphs, the objects are natural and man-made. They are measured in tons.
CUBE
A cube is a three-dimensional shape where every one of the six faces (or sides) is a square. All edges are the same length and all angles are right angles.
The polygons in the Biomass and Technomass graph are all cubes with six square faces. All edges are the same length and all angles of the faces are right angles. Because the cubes are drawn with some perspective, the depth of the cubes may not look like the same length. Given that the diagram shows the technomasses and biomasses in terms of volumes, in order to compare the volumes of different items, recall that the ratio of the volumes of two cubes is equal to the cube of the ratio of the respective side lengths. For example, suppose that the cube for humans has edges of length 2 and that the cube for plastics has edges of length 4. Although the dimensions of the cube for plastics are 2 times the dimensions of the cube for humans, the ratio of the volumes of these cubes is (2 x 2 x 2) to (4 x 4 x 4), or 8 to 64. The volume, and therefore the mass of plastics, is 8 times the mass of humans.
The graph for “What’s Going On in This Graph?” was selected in partnership with Sharon Hessney. Ms. Hessney wrote the “reveal” and Stat Nuggets with Erica Chauvet, a mathematics professor at Waynesburg University in Pennsylvania, and moderates online with Al Lebovitz, a math teacher at Willamette High School in Eugene, Ore.
More?
• See all graphs in this series or collections of 75 of our favorite graphs, 28 graphs that teach about inequality and 24 graphs about climate change.
• View our archives that link to all past releases, organized by topic, graph type and Stat Nugget.
• Learn more about the notice and wonder teaching strategy from this 5-minute video and how and why other teachers are using this strategy from our on-demand webinar.
• Sign up for our free weekly Learning Network newsletter so you never miss a graph. Graphs are always released by the Friday before the Wednesday live moderation to give teachers time to plan ahead.
• Go to the American Statistical Association K-12 website, which includes teacher statistics resources, Census in the Schools student-generated data, professional development opportunities, and more.
Students 13 and older in the United States and Britain, and 16 and older elsewhere, are invited to comment. All comments are moderated by the Learning Network staff, but please keep in mind that once your comment is accepted, it will be made public.

